Developments in organic farming
Data from June 2024
Planned update: June 2025
Highlights
The total area under organic farming in the EU continues to increase, and in 2022 covered 16.9 million hectares of agricultural land.
Organic area made up 10.5 % of total EU agricultural land in 2022.
Increasing numbers and shares of some EU livestock are being reared organically in 2022: 5.4 million bovine animals (7.2 % of all bovines), 1.0 million cows (4.9 %) and 6.1 million sheep (10.4 %).
This article describes the situation of organic farming in the European Union (EU). Wherever possible, a comparison with agriculture as a whole is made.
Full article
Total organic area
More and more agricultural land going into organic farming
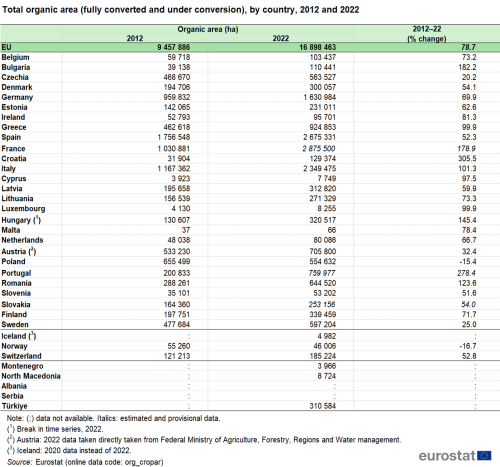
The total area of agricultural land in organic production (hereafter referred to as 'organic area') in the EU was an estimated 16.9 million hectares (ha) in 2022. These latest data confirm the continuation of a fast and sharp expansion in organic areas in the EU: between 2012 and 2022 there was an estimated increase of 7.4 million hectares, equivalent to a rise of 79 % (see Table 1).
The total organic area is the sum of the 'area under conversion' and the 'certified area'[1]. Before an area can be certified as 'organic', it must undergo a conversion process, which may take 2-3 years depending on the crop[2]. Therefore, data on areas 'under conversion' give an indication of the potential change in fully 'certified areas'.
Source: Eurostat (org_cropar)
Expansions in organic areas in almost all EU countries
Between 2012 and 2022, the total organic area increased in almost every EU country. The area quadrupled in Croatia over this period, the sharpest rate of increase within the EU. It also expanded particularly rapidly in Portugal (+278 %), Bulgaria (+182 %), France (+179 %), Hungary (+145 %), Romania (+123 %) and Italy (+101 %).
But which EU countries have the most land in organic production?
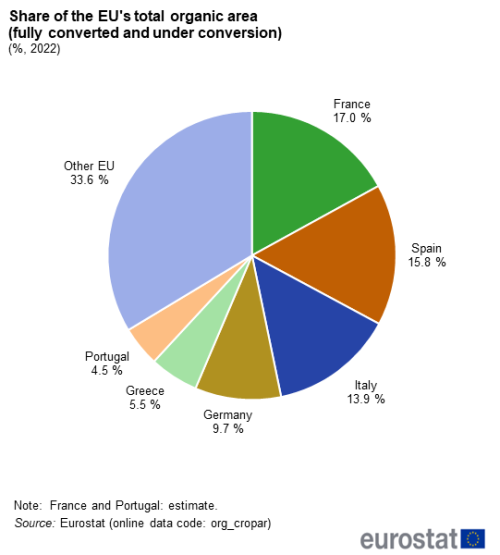
The total organic area in France was 2.9 million hectares in 2022 (equivalent to 17.0 % of the EU total), which was the highest number of hectares among the EU countries. France, together with Spain (2.7 million hectares of organic area), Italy (2.3 million hectares) and Germany (1.6 million hectares) accounted for a clear majority (56 %) of the EU’s total organic area in 2022 (see Figure 1).
(%, 2022)
Source: Eurostat (org_cropar)
Just over one in every ten hectares of utilised agricultural area in the EU was in organic production
One of the main objectives of the European Commission’s Farm to Fork strategy is to encourage the development of organic farming areas. It has set a target of at least 25 % of the EU's agricultural land being under organic farming by 2030.
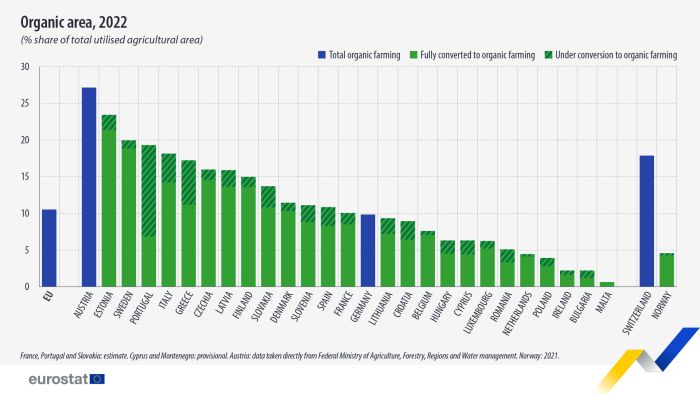
Between 2012 and 2022, the share of total organic area in the EU's total utilised agricultural area (UAA) rose from 5.9 % to an estimated 10.5 %[3].
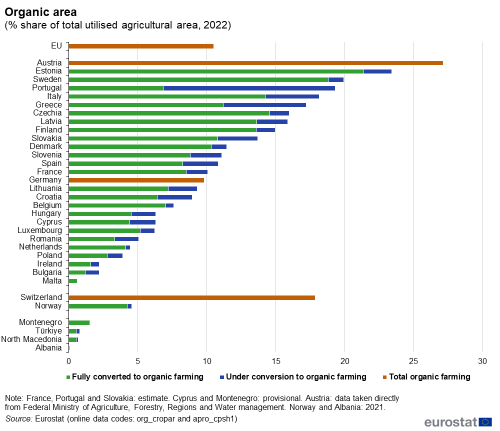
The countries with the highest shares of organic area within total UAA in 2022 were Austria (27 %), Estonia (23 %) and Sweden (20 %) - see Figure 2. Portugal, Italy, Greece, Czechia, Latvia, Finland, Slovakia, Denmark, Slovenia, Spain and France also had shares above 10 % in 2022. By contrast, the share of organic area remained below 5 % in five EU countries in 2022, with the lowest shares in Ireland (2 %), Bulgaria (2 %) and Malta (under 1 %).
(% share of total utilised agricultural area, 2022)
Source: Eurostat (org_cropar), (apro_cpsh1)
In almost all EU countries, the vast majority of organic areas were certified (hereafter termed 'fully converted'). More than 90 % of organic areas were reported as fully organic in Malta (albeit the country reporting the lowest rate of organic area within total UAA), Sweden, the Netherlands, Belgium, Estonia, Czechia, Finland, and Denmark in 2022. It should be noted that data for Germany and Austria on organic area are not separated into area 'under conversion' and 'fully converted'; only total organic area is reported.
The lowest shares of certified areas were recorded for Romania (66 %), Greece (65 %), Bulgaria (55 %) and Portugal (35 %), underlining the potential for further growth in certified areas in these countries over the coming years. Indeed, national support measures in Portugal led to almost a ten-fold increase in the organic area 'under conversion' between 2020 and 2022, from 50 000 hectares to 491 000 hectares. Due to the 2-3 years conversion period of agricultural land, a high share of area under conversion is necessary to avoid stagnation in the growth of the certified organic area.
Organic production
Sweden had the highest shares of cereals and fresh vegetables production that was organic in 2022
The organic production of cereals (for the production of grain, including seed)[4] remains a relatively small part of total cereals production in the EU. The highest shares recorded among EU countries in 2022 were in Sweden (7.0 % of the total cereals production), Estonia (6.6 %) and Italy (6.4 %) - see Figure 3.
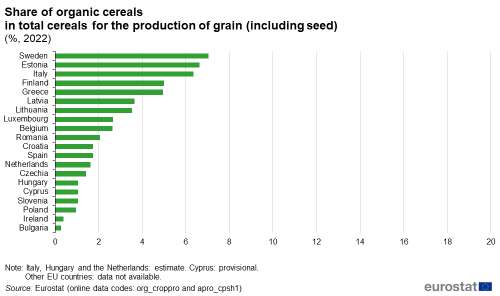
(%, 2022)
Source: Eurostat (org_croppro), (apro_cpsh1)
Sweden also had the highest share (19.2 %) of organic fresh vegetable[5] production in total vegetable production among EU countries (see Figure 4), followed by Germany (11.4 %) and Italy (6.3 %).
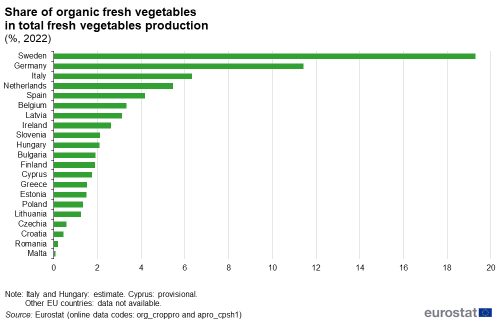
(%, 2022)
Source: Eurostat (org_croppro), (apro_cpsh1)
There is wide variation in the focus of organic production in EU countries
The EU's UAA is used for arable land crops (mainly cereals, root crops, fresh vegetables, green fodder and industrial crops), permanent grassland (pastures and meadows), and permanent crops (fruit trees and berries, olive groves and vineyards).
In 12 EU countries, more than one half of their respective total organic areas came from organic arable land in 2022
(see Figure 5). In particular, organic arable crops accounted for the vast majority of the total organic areas of Finland (98 %), Denmark (80 %), Sweden (77 %) and Poland (73 %).
In a separate 11 EU countries, more than one half of their respective total organic areas came from organic pastures and meadows. In particular, organic pastures and meadows accounted for the vast majority of the total organic areas of Ireland (88 %), Czechia (81 %) and Slovenia (79 %).
Whilst areas of organic permanent crops did not account for a majority of the total organic area in any EU country, they still accounted for above 20 % in 6 EU countries, including Cyprus (38 %), Malta (36 %) and Spain (30 %). Organic permanent crops accounted for less than 5 % of the total organic area in 16 EU countries.
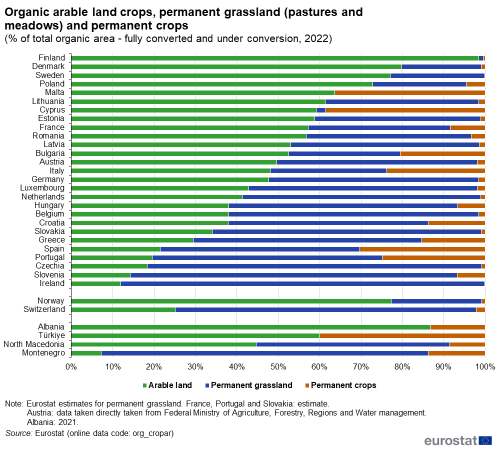
(% of total organic area - fully converted and under conversion, 2022)
Source: Eurostat (org_cropar)
Increasing numbers and shares of bovine animals, cows, sheep and goats being reared organically
Increasing numbers of bovines, sheep and goats are being reared using organic methods, during a period when the EU's livestock population has been declining. There were 5.4 million bovines being reared organically in 2022 within an EU herd of 74.8 million bovine animals (equivalent to 7.2 %), compared with 4.3 million bovines from an EU herd of 77.8 million in 2018 (equivalent to 5.5 %). Similarly, there were 1.0 million cows being reared organically in 2022 (4.9 % of the EU's cow herd), 6.1 million sheep (10.4 % of the EU's flock) and 1.4 million goats (12.7 % of the EU's goat herd).
Cattle, sheep and goats are grazing livestock. They are ruminant animals that digest plant-based feed. Other livestock, particularly pigs, are non-ruminants. There tend to be higher rates of organic grazing livestock than non-grazing livestock (see Figure 6). For example, between 30% and 45% of sheep and goats were being reared in 2022 using organic methods in Estonia (44 %), Czechia (41 %), Austria (36 %), Greece (35 %) and Latvia (34 %). Likewise, about 46 % of bovine animals in Greece were organic. Greece had also the highest share of organic dairy cows (31 %), followed by Austria (22 %) and Sweden (18 %). The share of pigs being farmed organically in 2022 was much lower, the highest being in Luxembourg (5 %), France and Denmark (both 4 %).
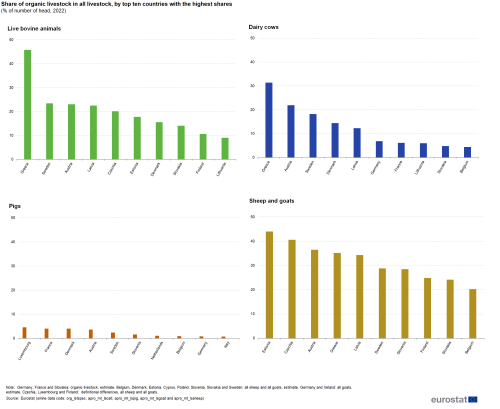
(% of number of heads)
Source: Eurostat (org_lstspec), (apro_mt_lscatl), (apro_mt_lspig), (apro_mt_lsgoat) and (apro_mt_lssheep)
Source data for tables and graphs
Data sources
The statistical information presented in this publication is drawn from the Eurostat database, available at the Eurostat website. Data used in this article includes unpublished data.
The annual organic production statistics and the farm structure survey data are the two main sources of organic farming data, both with their own aims and measurement approaches, which may lead in some cases to differences in the published data. Comparison between the two data sources should be performed with caution, since certain differences in definitions of variables, concepts, surveys design and timing of the collections can cause discrepancies in the data. Differences in number of animals for example are usually due to the time of the year when the data were collected from each of the data sources. A comparison of the two data sources regarding organic farming growth rate shows that both sources are broadly comparable when analysing the trend of the organic farming growth in the EU.
Organic farming statistics
Annual data collection. Data are provided by the EU Member States, Iceland, Norway, Switzerland, Turkey, North Macedonia, Montenegro, Albania and Serbia on the basis of a harmonised questionnaire. Data in this annual collection originate from the administrative data of national entities in charge of the certification of operators involved in the organic sector. Up to reference year 2007, data provision was voluntary. From reference year 2008 onwards, data have to be delivered following Commission Regulation (EC) No 889/2008, implementing Council Regulation (EC) No 834/2007. Since 1 January 2022, European Parliament and Council Regulation (EC) No 848/2018 of 30 May 2018 on organic production and labelling of organic products and repealing Council Regulation (EC) No 834/2007, as amended by European Parliament and Council Regulation (EC) No 1693/2020 of 11 November 2020 is the applicable legislative act, also known as the basic act; however, Regulation (EU) 848/2018 does not contain a legal basis for collecting agricultural statistics. Therefore, starting from the reference year 2021, data collection is based on the ESS Agreement on organic production statistics.
Livestock statistics
The Livestock survey data are used for comparing the organic livestock data with the data on total livestock production. It is an annual data collection. The statistical unit is the agricultural holding. The data used in this article are produced with reference to a given day in November/December.
Crop statistics
The annual crop statistics area data that are used in this article encompass the total utilised agricultural main area (including kitchen gardens). The main area corresponds to the area of the land parcels, which refers to the physical area of the parcel(s), regardless of whether there was only one single crop or several crops on a parcel during the harvest year. Other annual crop statistics data used, are the harvested production for cereals for the production of grain (including seed) and the harvested production of vegetables.
Direct access to
- Key figures on the European food chain – 2023 edition (Statistical book)
- Organic farming, see:
- Organic farming (org)
- Organic operators by status of the registration process (from 2012 onwards) (org_coptyp)
- Organic crop area by agricultural production methods and crops (from 2012 onwards) (org_cropar)
- Organic crop production by crops (from 2012 onwards) (org_croppro)
- Organic livestock (from 2012 onwards) (org_lstspec)
- Organic production of animal products (from 2012 onwards) (org_aprod)
- Organic production of aquaculture products (from 2012 onwards) (org_aqtspec)
- Processors of organic products by NACE Rev. 2 activity (C) (from 2012 onwards) (org_cpreact)
- Agriculture, see:
- Farm structure (ef)
- Main farm indicators by NUTS 2 regions (ef_mainfarm)
- Farm structure – 2008 legislation (from 2005 onwards) (ef_main)
- Agricultural production (apro)
- Crops (apro_crop)
- Crop production (apro_cp)
- Crop production in EU standard humidity (from 2000 onwards) (apro_cpsh)
- Crop production in EU standard humidity (apro_cpsh1)
- Crop production in EU standard humidity (from 2000 onwards) (apro_cpsh)
- Crop production (apro_cp)
- Animal production (apro_anip)
- Livestock and meat (apro_mt)
- Livestock (apro_mt_ls)
- Bovine population – annual data (apro_mt_lscatl)
- Goats population – annual data (apro_mt_lsgoat)
- Sheep population – annual data (apro_mt_lssheep)
- Pig population – annual data (apro_mt_lspig)
- Livestock (apro_mt_ls)
- Livestock and meat (apro_mt)
- Crops (apro_crop)
- Organic farming statistics (ESMS metadata file – org_esms)
- Questionnaires used for data collection
- Farm structure survey (ESMS metadata file – ef_sims)
- Crop production statistics (ESMS metadata file – apro_cp_esms)
- Animal production statistics (ESMS metadata file – apro_anip_esms)
- Council Regulation (EC) No 834/2007 of 28 June 2007 on organic production and labelling of organic products and repealing Regulation (EEC) No 2092/91
- Summaries of EU Legislation: Production and labelling of organic products
- Commission Regulation (EC) No 889/2008 of 5 September 2008 laying down detailed rules for the implementation of Council Regulation (EC) No 834/2007 on organic production and labelling of organic products with regard to organic production, labelling and control
Notes
- ↑ Data for Germany, Austria and Switzerland on organic area are not separated into area 'under conversion' and 'certified organic' due to lack of data. Only total organic area is reported.
- ↑ For plants and plant products to be certified organic, the production rules must have been applied on the parcels of land during a conversion period of at least two years before sowing, or, in the case of grassland or perennial forage, at least two years before its use as feed from organic farming, or, in the case of perennial crops other than forage, at least three years before the first harvest of organic products.
- ↑ Total UAA (main area) from the annual crop statistics table apro_cpsh1 is used as denominator.
- ↑ Cereals for the production of grain (including seed) refers to the code C0000 (from the code list CROPS). According to the annual crops statistics handbook (2023 edition), it includes all cereals harvested dry for grain, regardless of the use.
- ↑ Fresh vegetables refers to the code V0000 (from the code list CROPS). According to the annual crops statistics handbook (2023 edition), it includes all brassicas, leafy and stalked vegetables, vegetables cultivated for fruit, root, tuber and bulb vegetables, fresh pulses and other vegetables harvested fresh (not dry).
